- Location: Greenwich local authority, England.
- Worst ranking: Pothole handling among England’s poorest.
- Council response: Disputed government’s figures strongly.
- Concerns raised: Doubts on calculation methods used.
- Status: Official data challenged by council.
The Labour council is one of 13 that have received a “red” rating for the way it uses public funds to manage the roads. The A2, A20, A102, and A205 are among the major thoroughfares managed by Transport for London, which received an “amber” rating.
Greenwich will now receive “dedicated support” to improve its transport department, but officers at the Woolwich Centre won’t need to search far for inspiration because nearby Lewisham is one of the few municipalities rated “green.” Along with the great majority of English authorities, Bexley and Bromley received an “amber” rating.
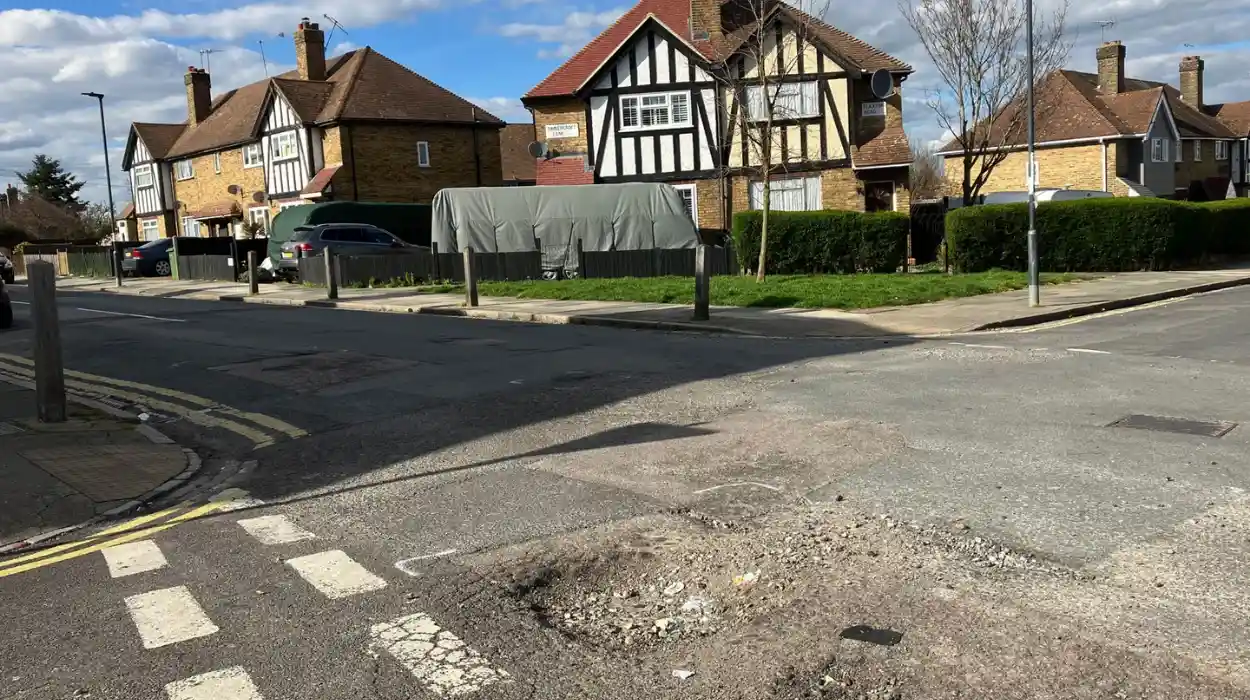
However, many locals would be familiar with areas like Edmund Halley Way near North Greenwich station that are plagued by bad road conditions.
Included are the amount of money councils spend on road maintenance and whether or not they are adhering to best practices. The numbers are based on information that the councils themselves provided to the Department for Transportation.
Greenwich, however, claims that it was attempting to improve its rating and that the information it provided to the DfT did not cover all of their road spending.
The transport secretary, Heidi Alexander, stated that she was taking action due to the growing costs associated with pothole repairs for drivers. Although the Labour government did not address this in its speech, poorly maintained roads can have much more detrimental effects for bikers.
She said:
“For too long, drivers have paid the price because our roads were left to deteriorate. I have heard time and again their frustration on footing the bill because they hit a pothole – money they should never have to spend in the first place.
We’ve put our money where our mouth is, increasing the funding for local highway authorities with £7.3 billion to fix roads and giving them the long-term certainty they have been asking for. Now it’s over to them to spend the money wisely, and for the first time, we are making sure the public can see how well councils are doing in delivering the improvements they want to see in their local area.”
Guy Roberts, a homeowner, responded to the article on social media by claiming that Greenwich Council employees had informed him that roads in need of repair were just selected from a hat, and the work was completed until the funds ran out. Comments have been requested from the council.
Although Greenwich contests the comparison, examining Greenwich’s data and contrasting it with Lewisham’s reveals the main figures behind the embarrassing award.
Greenwich only spent £2.8 million on its 300-mile road network in the most recent fiscal year, of which 54% went toward “preventive maintenance” to stop potholes from appearing in the first place and the remaining amount went into repairs. However, Lewisham’s 244-mile network cost more than £9 million.
Although Greenwich anticipated spending a comparable amount this year, just 38% of that amount would be allocated to preventive maintenance, compared to 79% of Lewisham’s £7.7 million.
However, as part of a pre-election splurge, Greenwich has raised its road investment since submitting this year’s data to the DfT. An additional £1.6 million will be invested this year and each year until 2030.
Calum O’Byrne Mulligan, the cabinet member for transport, said:
“We have raised concerns about details of this methodology with the DfT and we are working with them on this.
The data we provided to the DfT in June 2025 also only included our direct spend on resurfacing roads and not spend on other important measures like winter gritting, street lighting and bridges, that we would not ordinarily consider part of road condition works but we understand could be considered in this assessment.
Since the DfT collected its data last summer, we have resurfaced 21 more roads, completed more condition surveys, appointed a new contractor, as well as doubled our budget.
To do this we have matched the much welcomed and long overdue increase in funding from the DfT, which has increased six-fold recognising the chronic underfunding all councils experienced under the previous government. This investment will help us fill hundreds more potholes and more than double the number of roads we fully resurface annually.
We welcome any support to help us continue to improve our highways and our experience for our residents, so we look forward to working with the DfT and to help it standardise its new rating system and update Greenwich’s condition rating accordingly.”
How did the Department for Transport calculate the red amber green ratings?
The Department for Transport calculates red, amber, green( RAG) conditions for 154 English original trace authorities using 11 numeric criteria grouped into condition, spend, and stylish practice orders, each scored 0- 100 and combined into an overall assessment.
Individual order scores use fixed thresholds 0- 45( red), 45- 80( amber), 80- 100( green). Overall conditions apply stricter cutoffs, taking balanced performance across pillars Greenwich scored red primarily due to low preventative conservation allocation( 54 vs. 83 in green- rated Lewisham).
June 2025 data submission yielded Greenwich’s red standing despite £2.8 m spend rising to £4.4 m, as DfT barred gritting/ islands and applied static nascences council controversies turning 300- afar network assessment banning TfLA-roads.